Beginner Guide to EZ Tools
Windows Forensics
Hands-On
Beginner-Friendly
DFIR
Apr 9, 2026

Beginner Guide to EZ Tools
This blog post will cover a complete guide to using all Eric Zimmerman tools, known as EZ Tools. The EZ Tools are a number of different command line and GUI tools created by Eric Zimmerman. These tools are open source and serve a wide range of forensic analysis purposes, which make them critical additions to an investigators toolkit.

Introduction
The tools are published on Eric Zimmerman's github page and the full download link list can be found here: https://ericzimmerman.github.io/#!index.md. The website lists the tools Name, Version, and Purpose. In the Name column, names including Cmd represent command line tools and names including Explorer represent GUI tools. In the Version column, different download links are provided based on the version of .NET they use. For example, it is critical that if you choose a .NET 9 tool version that your system has Microsoft .NET 9.0 installed. In the Purpose column, you will see a brief description of what the tool does. In the “Other tools” section of the page, there is a PowerShell script named Get-ZimmermanTools. If you would like to download or update any EZ Tools, this script can be very useful for quickly downloading and updating all of the available tools.
Note: This blog has been updated to reflect that .NET 6 has officially reached end-of-life and is no longer used in any of the tools available on the Eric Zimmerman tools github.
The command line tools range from LECmd to parse lnk files, EvtxECmd to parse Windows Event Logs, RBCmd to parse Recycle Bin artifacts, PECmd to parse prefetch files, and many more. The GUI tools range from JumpList Explorer, MFTExplorer, Registry Explorer, Shellbag Explorer, and more. Practically every critical Windows forensics artifact can be in some way processed and analyzed using just Eric Zimmerman tools.
There are currently over 25 unique tools to understand. While that could be overwhelming, all of the EZ Tools have very similar, mostly identical, use patterns. All the tools ending in Cmd use the same command line argument definitions. With this, as long as you understand the basics of creating an EZ Tool command, you will be able to use many of the tools with the same knowledge. Furthermore, the tool EZ Tool Timeline Explorer can be used to view the processed output of all of these command line parsers with ease.
In this blog, we will walk through the basics of navigating the EZ Tool command structure and arguments. Next, you will learn how to view your command line parser results using Timeline Explorer and how to optimize an investigation with the tools' many capabilities. Additionally, the basics of using Registry Explorer, a powerful GUI based EZ Tool for examining Registry Hives, will be covered.
Command-Line Tools
For the purposes of this guide, I am using PECmd. Although, as noted earlier, the command structure and arguments are universal across all command line EZ Tools.
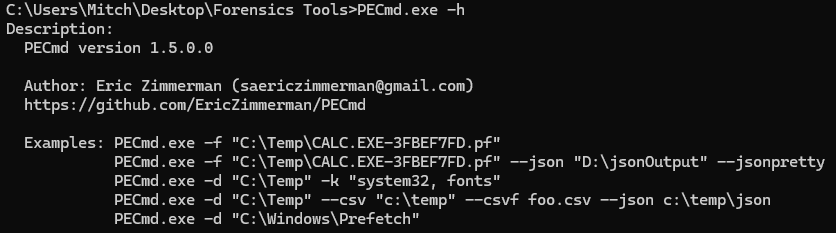
First, the -h option can be used to list a brief description of the tool, some usage examples, and all of the available arguments to pass the tool. The Description and Examples of PECmd.exe are pictured below.
Next, the Options section is pictured below. Here, all of the potential arguments to define in an EZ Tools command are listed. We will not cover every option, only the basics which are necessary to understand to use the tools in a beneficial manner.
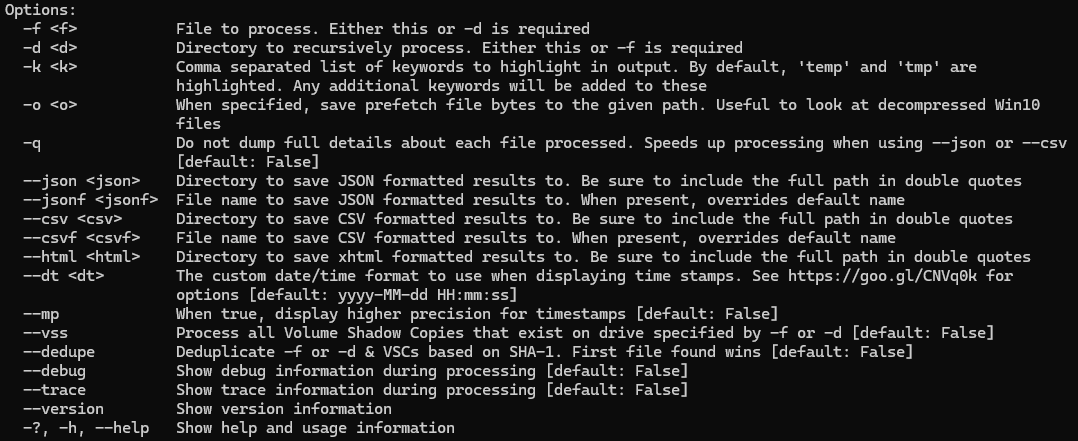
-f : specifies a single file to process. For example, if you would like to pass PECmd a single prefetch file, you would use -f “<Location to Prefetch File>”
-d : specifies a directory to process. For example, if you would to pass PECmd a folder containing prefetch files extracted from your evidence, you would use -d “<Location to Prefetch Folder>”
--json, --csv, and --html : These three options specify the format of the commands output. The options are a json, csv, or html file. Following your output argument, you list the directory to save your results. For example --csv “<Location to Store Output.csv>”.
--jsonf and --csvf : These two options allow you to specify the name of your output file. This argument is not necessary, but can be beneficial in organization of your results. Following the argument, list the name you want to give the file. For example, using PECmd I could use --csvf “EvidenceItem001_Prefetch.csv”
Note: Quotes around the specified paths can be very important to ensuring the command runs as desired. If your path has a space character, the program will interpret this as the stopping point of your path. Best practice is to always use quotes around your paths to ensure the command runs as desired.
Command Example: Now that we’ve walked through the basics, let’s examine a simple command which can be used for many of the Cmd tools.
>(EZToolCmd).exe -d “C:\Example\Path\To\Folder\” --csv “C:\Example\Path\To\Output\Folder\” --csvf “ExampleOutput.csv”
With this simple command, you know everything required to use the command line EZ Tools, it’s really that easy. Many Windows forensics artifacts can be processed just by using the proper EZ Tool and the command above, some with slight modifications. If anything comes up when using certain tools which require or can use additional arguments, the help menu can always be used to figure out the new inputs.
When choosing an output format for the results, I personally always use CSV. This is because of the next tool we will discuss, Timeline Explorer. If you prefer HTML or JSON file formats, there is nothing wrong with that. Although, using the CSV format allows for the use of Timeline Explorer, a powerful tool for filtering and sorting through large CSV files.
Using Timeline Explorer
Now that we’ve seen how to use the command line EZ Tools to parse various forensic artifacts, we must learn how to view your processed output. The EZ Tool Timeline Explorer is a CSV file viewer which has numerous features which help an investigator optimize the analysis of their evidence. The tool can be downloaded from the same link provided in the Introduction, where all the other EZ Tools are available.
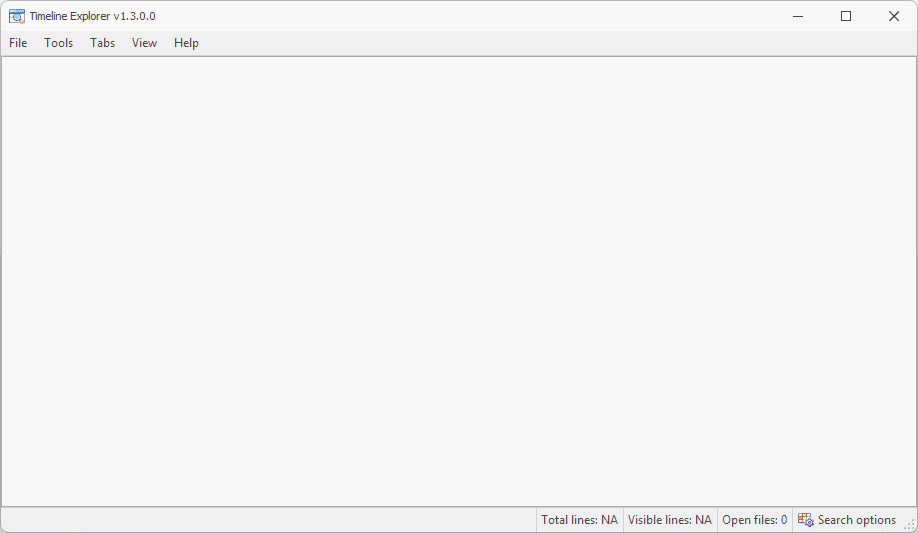
Pictured below is the Timeline Explorer GUI with no files opened.
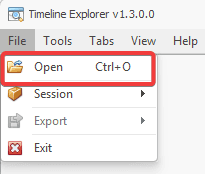
To open a file, select File then Open, as pictured below. This will launch File Explorer and you can navigate to the CSV output file which you would like to view.
To examine some of the useful features Timeline Explorer has, I will be using a Windows Event Log CSV file which I created using EvtxEcmd and by changing the example values of the command we created previously.
I’ve opened my file, named EventLogs_EZToolsPractice.csv in Timeline Explorer and my screen is pictured below. You may first notice that there are horizontal and vertical scroll bars which can be used to explore all of the CSV data.
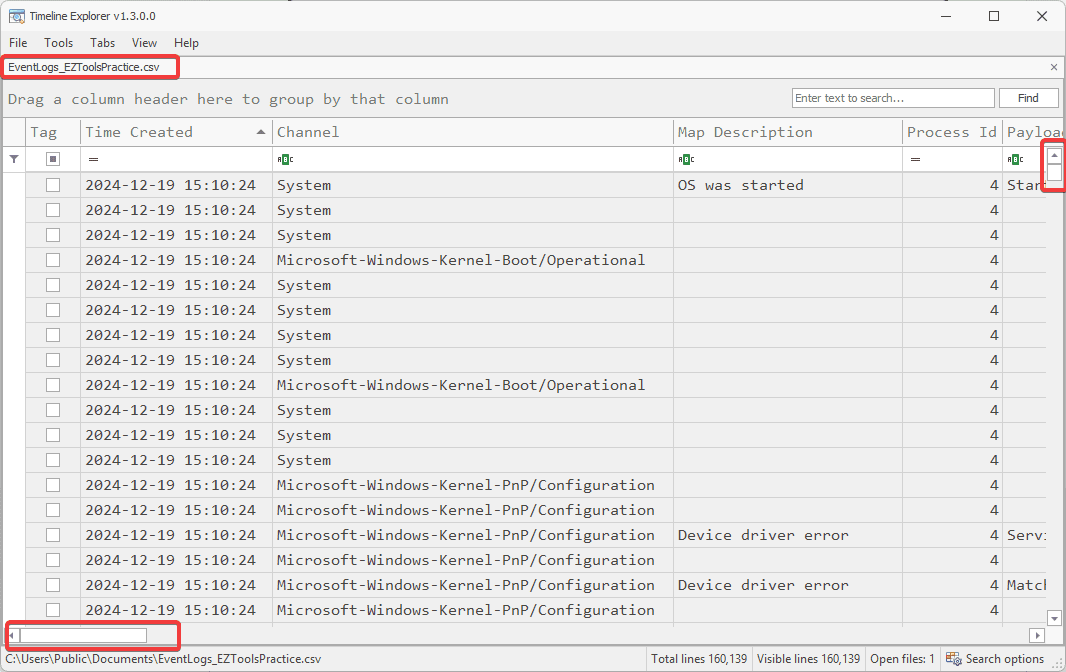
Since we are looking at CSV files, each row represents a single artifact, in this case a Windows Event, and each column represents a data field, in this case, we have data fields such as Channel and Map Description.
If you right click on a column, in this case Channel, it will open an options menu. Here is where you can turn a lengthy investigation into a targeted mission. By mastering these options, you will learn how to find the information you are searching for much faster.
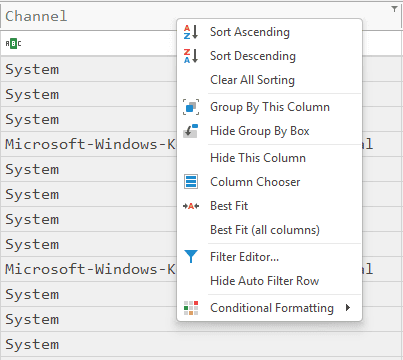
Sort Ascending and Sort Descending: Options which can be used to order your results in the ascending or descending order based on the value in the column you’ve selected. These options are very useful if you are sorting by a Timestamp value.
Clear All Sorting: This option will reset the sorting you have selected if you used the previous two options.
Hide This Column: This option is used to hide a column from the screen. This option can be very useful to remove some of the “clutter” data which is not useful to your investigation. Additionally, this option can be used to remove columns in order to take clear and focused screenshots for your reports!
Group By This Column: This option is used to group the results based on the column you selected.
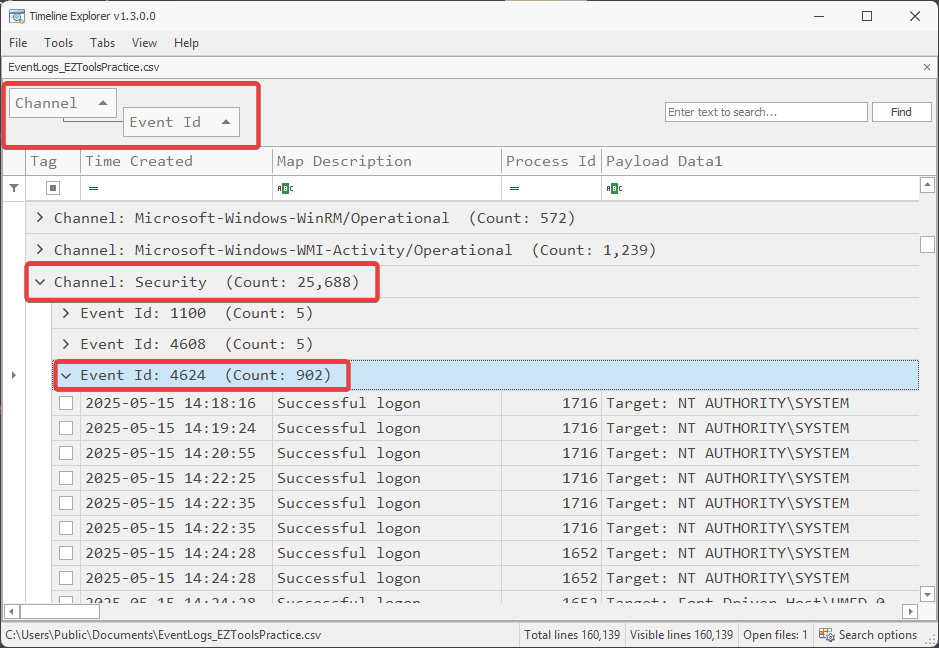
Combining all of these options, you can find the information you are looking for much faster. For example, when examining the Windows Event Logs, we can Group By Channel then Group By Event ID. This will sort our results by the Windows Event Log Channel and the Event ID, so we can have a targeted search.
In the picture below, you can see that I have expanded the Security channel then Event ID: 4624, which corresponds to a successful logon. Now, I can easily navigate to all the successful logons without searching through thousands of logs.
Now, we could go even further to narrow our search even more. In the case of Security log Event 4624, the Logon Type field is stored in Payload Data 2. Now, if we group by this column, we can examine our results based on the logon type. Then, we can sort by the Time Created.
Now, pictured below we can see the first three Security logs for Event ID 4624 with logon type 7. Security event ID 4624 represents successful logon and logon type 7 represents “Unlock logon”, or when a user unlocks their machine.
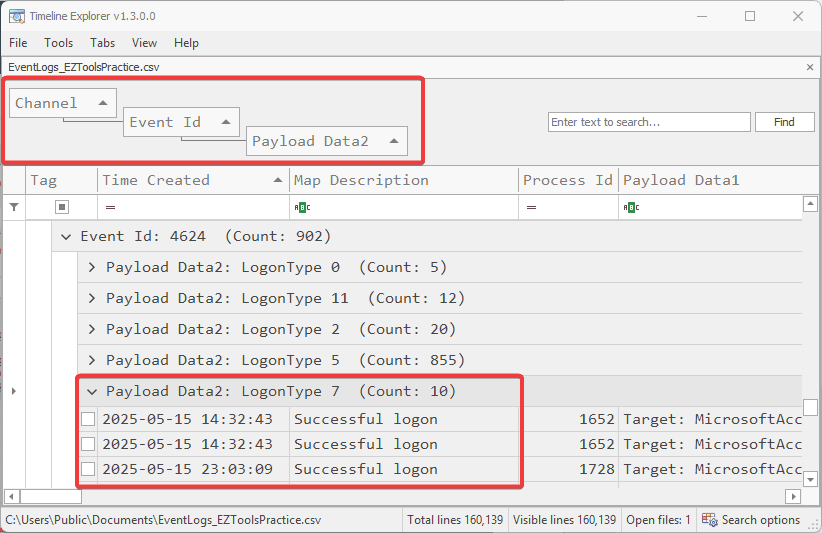
So, by using the sorting options we have quickly navigated to the first three successful user logons. Instead of manually searching through thousands of Windows Event Logs, we quickly found the information we were targeting.
By using the strategies found in this example, you can find the information you are seeking much quicker and easier using Timeline Explorer. As long as you output your command line EZ Tools results in CSV file format, you will be able to open and examine them using Timeline Explorer.
Using Registry Explorer
Registry Explorer is one of the GUI based EZTools which I use the most. The tool is used to load and examine Windows Registry hives. Since Windows Registry hives are one of the most critical sources of forensic artifacts, this tool is one of the most important to understand how to use. Additionally, just like the EZ Cmd tools, the EZ GUI tools have very similar UI’s which make using them much easier once you have experience using just one. Some other EZ GUI tools I rely on frequently and highly recommend are ShellBagsExplorer and MFTExplorer. Most of these GUI tools also have special features which can aid in speeding up a forensic investigation, which we will discuss for Registry Explorer.
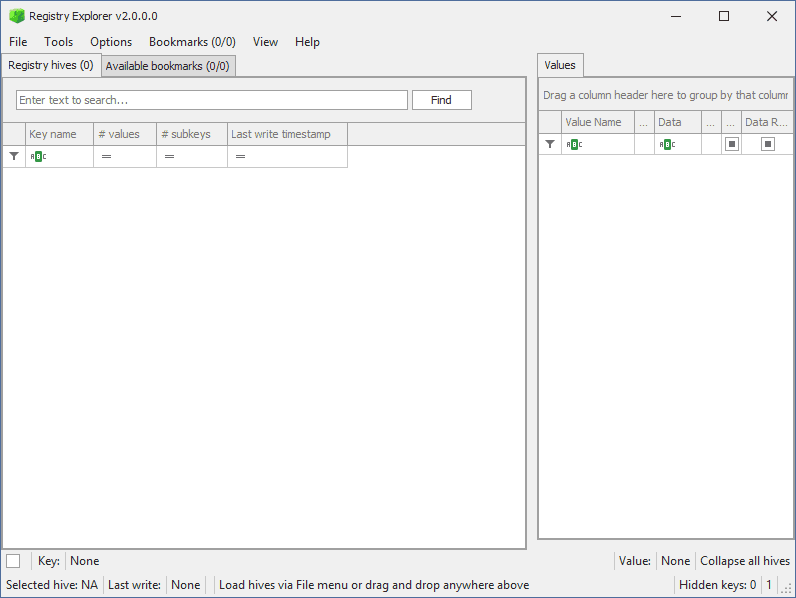
The tool can be downloaded from the same location of all other EZTools, found in the Introduction. When you first launch Registry Explorer, you will see the screen pictured below.
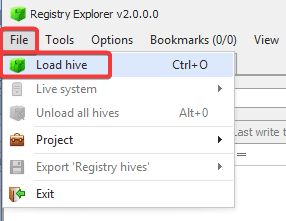
The first step is loading a hive. This can be done by selecting “File” then “Load hive”. This will open a File Explorer window which will allow you to navigate to and select the hive you wish to examine.
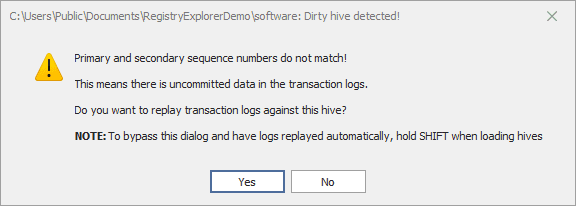
When you have loaded a hive, you will likely be greeted by the screen below. If the hives were taken from a live system, then the files will have data in the transaction logs which has yet to be written to the hive. If you are able to acquire the logs, you can select “Yes” on this screen, and load the logs with the hive. This will ensure all up to date data is being shown.
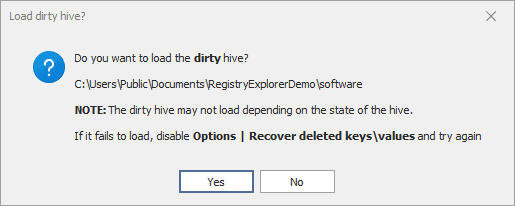
If you select “No”, then select “Yes” to load the dirty hive, you will still be able to access the hive’s data.
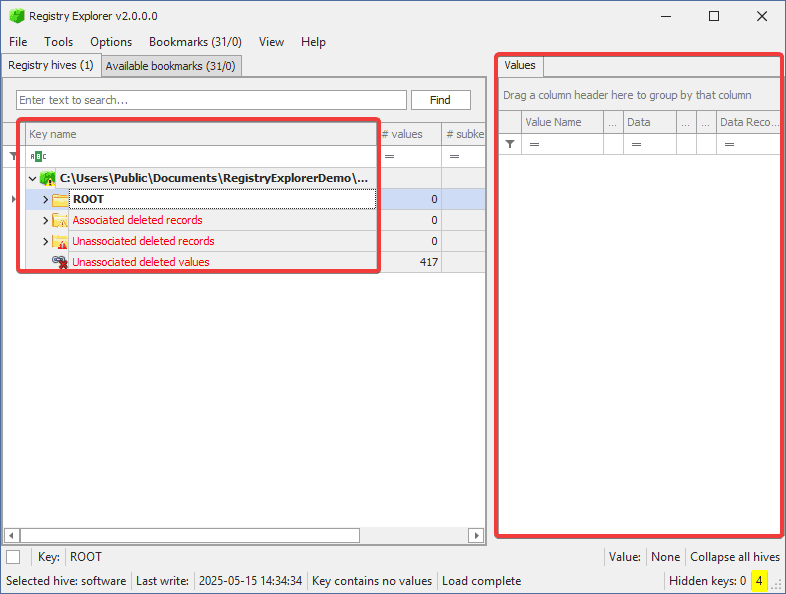
When you have loaded a hive, the screen will appear as pictured below. The GUI is separated into two sections. On the right, it will display the structure of the hive. Using the “>” buttons, you can expand each folder to examine more keys. On the left, you will see the value associated with whatever key you have selected appear.
The most useful feature of Registry Explorer is the Bookmarks tab. Here, Registry Explorer will list common Windows Registry artifacts. If you select one of these artifacts, you will jump to its location in the hive. The image below shows how you can find these bookmarks by selecting Bookmarks at the top of the window, then Common will reveal a right side pane with the links to common artifacts of interest.
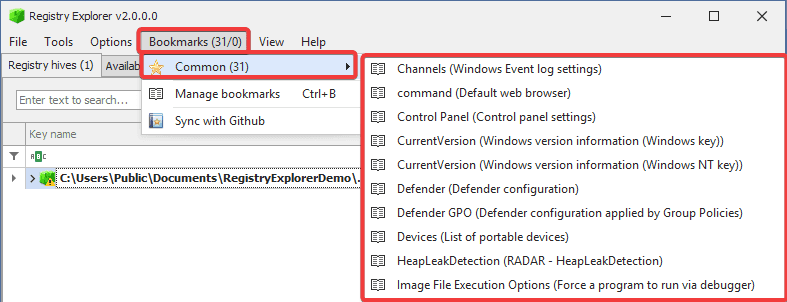
The number of bookmarks will change depending on the hive you are examining. For example, in the example above we are examining the SOFTWARE hive, which has 31 bookmarks. The SAM hive, which stores much less data, will have significantly less bookmarks. Bookmarks cannot be used to find every forensic artifact, but they can speed up your investigation by allowing you to find artifacts of interest without the searching. Without bookmarks, the hive can be manually explored using the file system-like GUI.
Registry Explorer is easy to use and is an excellent tool for anyone in DFIR analyzing registry hives. Using bookmarks can speed up an investigation while the GUI can help an investigator find any registry artifact they need.
Conclusion
Eric Zimmerman’s tools are an essential part of any DFIR practitioner’s toolkit. The EZ Tools are beginner-friendly and all free to use, making them an excellent starting point for anyone starting their journey in DFIR. The command line tools have a consistent usage which makes them very friendly to use. Timeline Explorer is a powerful CSV analysis tool which can be used to conveniently examine your processed EZ Tools results. Additionally, Registry Explorer is a great registry analysis tool and one of the many EZ GUI tools which make Windows forensics easy. EZ Tools cover almost every Windows artifact, making them essential for Windows forensics.
I highly recommend practicing with these tools to get comfortable using them. Try running some of the Cmd tools against some of the Windows artifacts on your own system, or from a practice image. Load the results into Timeline Explorer and analyze the results for yourself! Additionally, load a registry hive into Registry Explorer and challenge yourself to examine the variety of data stored in the hive of your choice. There are plenty of free case studies available in the Cyber5W academy that can be used to practice using the EZ Tools.
Authored by:
Mitchell Biagini

Frequently asked questions
Still have questions?
Can’t find the answer you’re looking for? Please chat with our friendly team.