Using Zui for Network Forensics
Mar 4, 2026

Overview
Zui is a free GUI tool used for bulk network traffic analysis, formerly known as Brim. The tool has great capabilities for filtering and sorting through a large amount of network traffic to quickly identify the relevant data. Zui will take an imported PCAP file and generate Zeek and Suricata events based on the traffic. Additionally, the imported traffic will be able to be queries using the Zed language. The language provides for easy and effective sorting which allows for the bulk network traffic analysis to be so efficient. To take advantage of these features, all that is required is to upload the PCAP file(s) for processing by Zui then navigate the many features of the tool.
Getting Started
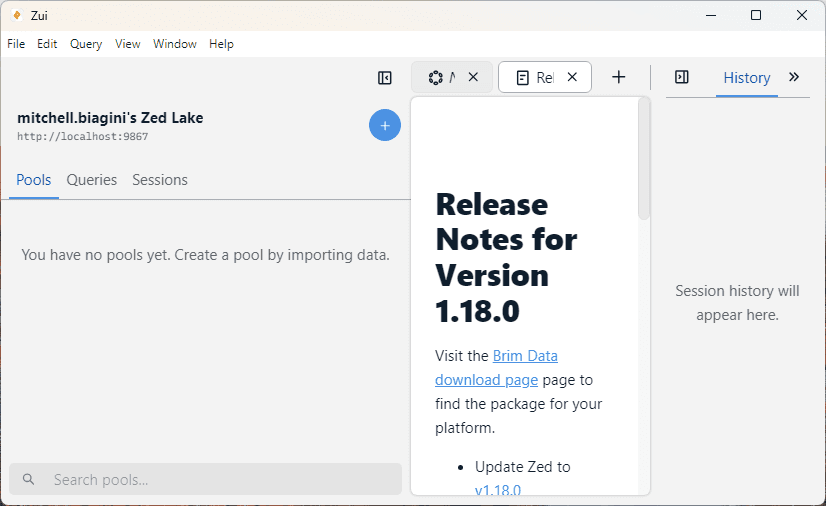
First, download the tool from the official website: https://www.brimdata.io/download/. The installation process should only take a few minutes. After the application launches, you should be greeted by a screen such as the one pictured below:
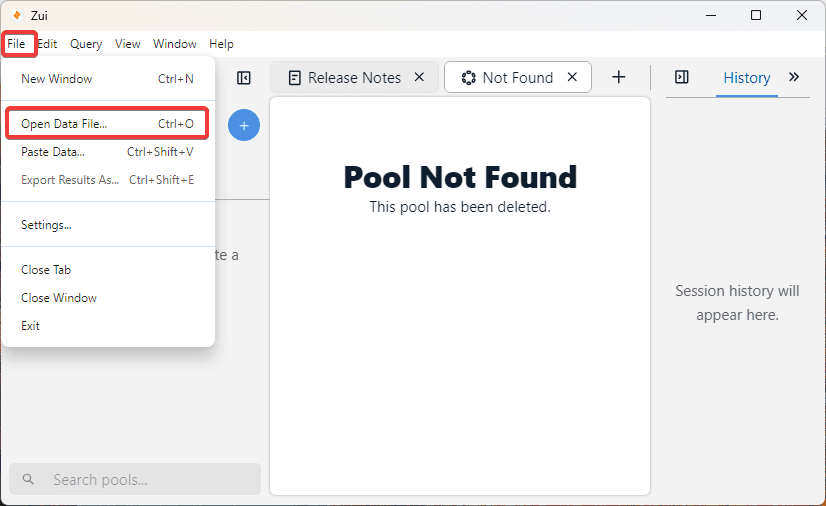
Next, we want to import the PCAP file(s) that we are working with. For this walkthrough, I will be using free PCAP files used for training that can be downloaded from here. Specifically, I will be using the sample named 2022-01-03 -- Pcap from web server with log4j attempts & and other probing/scanning. When you first launch Zui, select the “File” then “Open Data File” options. Alternatively, you can also drag and drop the PCAP file into the Zui windows. Either option will start the processing of the PCAP processing.
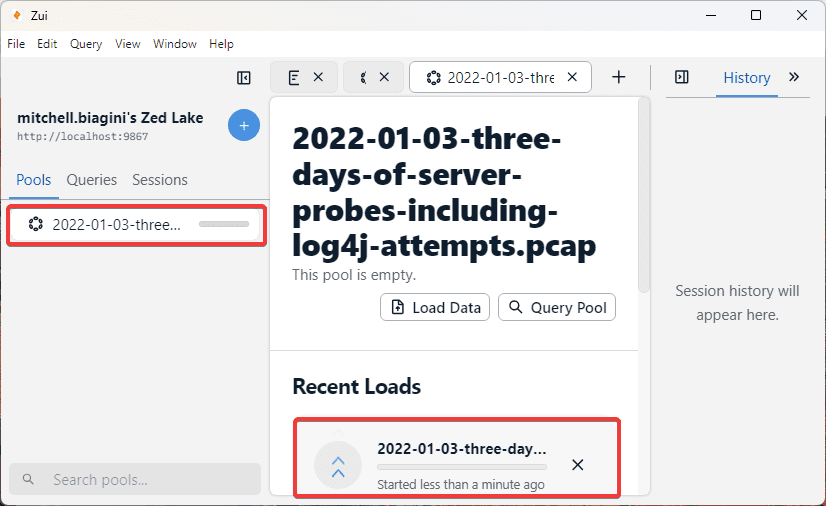
Selecting the Open Data File option will launch the File Explorer dialogue. Select the PCAP file here and the tool will start the processing of the data. As shown in the screenshot below, a new Pool has been created in Zui. In the middle window, we can see under Recent Loads that the file is processing.
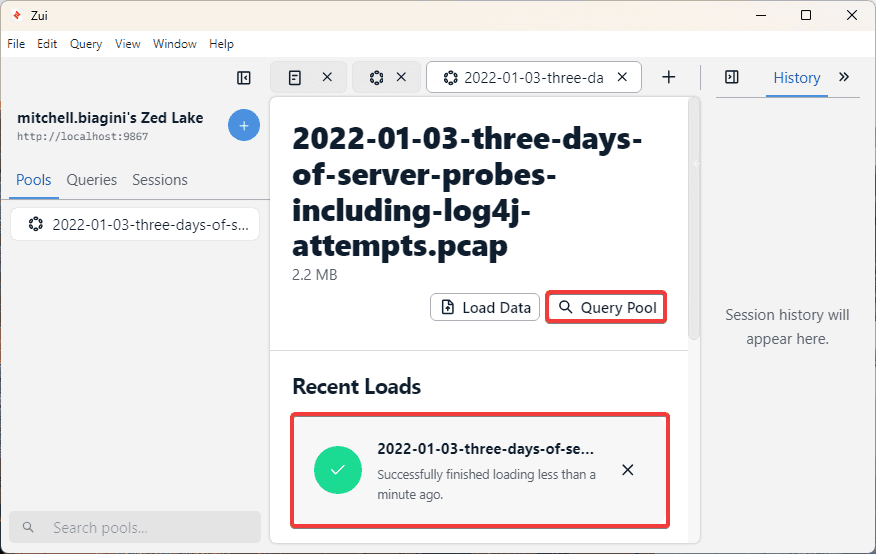
The processing should only take a few minutes, however, depending on the size of the packet capture, the time will vary. As we can see in the screenshot below, when the processing is complete, there will be a check mark next to the Recent Loads. To access and start browsing through the data, select the Query Pool. If there are multiple PCAP files apart from the same analysis, this is where we can stop and upload one or more additional files. By selecting the Query Pool option, we will be able to start viewing the network traffic.
Walkthrough
Now that we have uploaded some data, let’s understand the three window panes of the GUI.
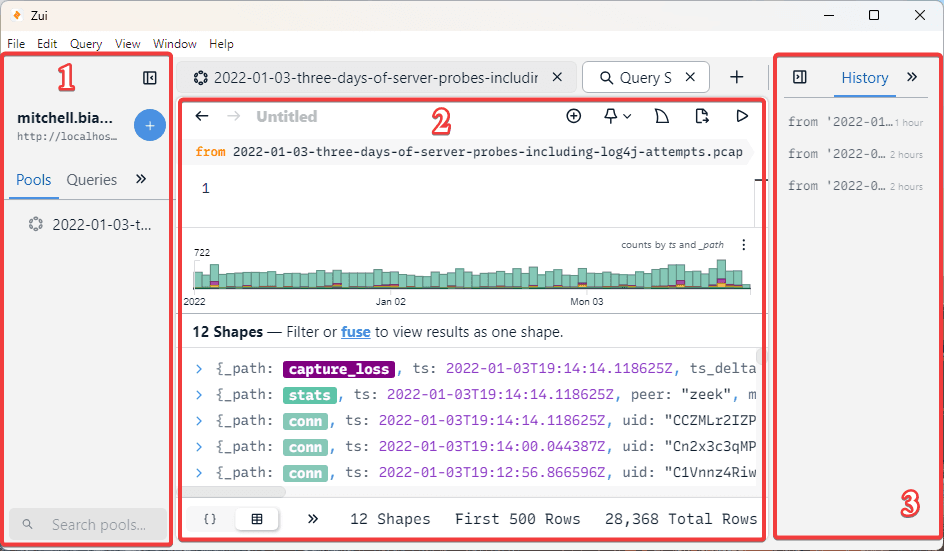
The windows labeled 1 in the screenshot below is where we can see the Pools. These are different projects that we are working on. So, if we upload an additional PCAP file, we may place it into a new Pool to separate it from the first. We also see Queries, here the Queries that we write with the Zed language will be stored. We will examine this in greater detail later.
Next, the window labeled 2 is where we see the results of the Query Pool option we just selected previously. We will start to look at this window individually in the next section. For now, this window features a lot of important information and will be our primary analysis window.
The final pane, labeled 3 in the screenshot below, has four individual features which will be examined in a later section.
Focusing on the Query Session page, we can now see a couple of different GUI sections related to our network traffic.
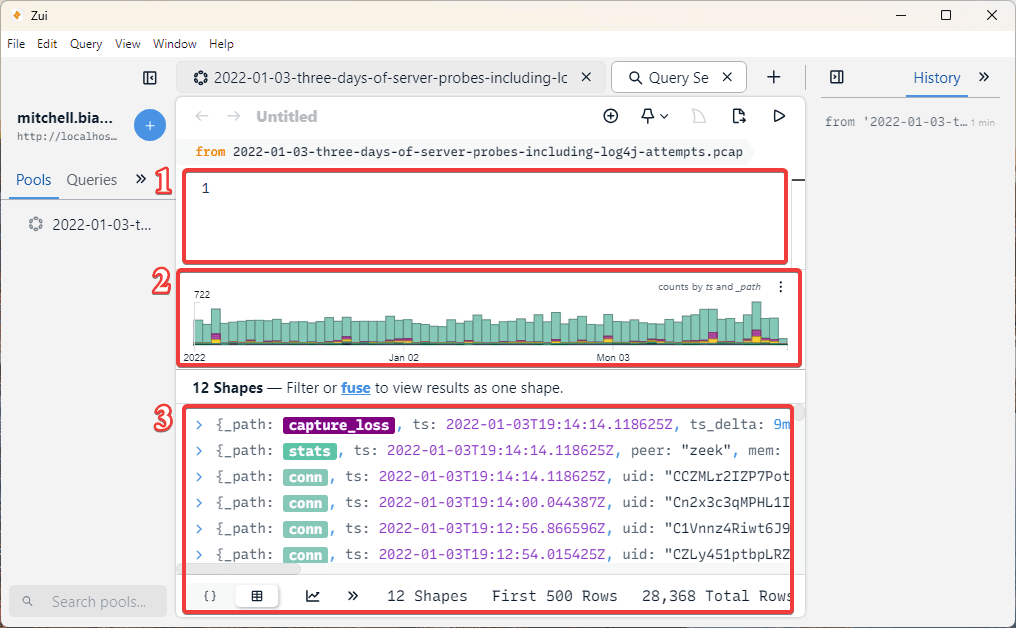
At the top of the GUI, labeled 1 in the screenshot below, there is a small window where you can write custom Queries. The queries are built off the Zed language previously discussed. These queries are written in order to extract and search for particular items or details of interests. For now, we will not discuss the query language, but we will take a look at some pre-written queries later on.
Next is the histogram of the events, particular times can be selected to show the events corresponding to the date. This section is labeled 2 in the screenshot below.
Lastly, the actual network traffic events are shown in the section labeled 3 in the screenshot below. Here, this is where we can see the Zeek and Suricata events that have been detected and organized for analysis.
On the right sidebar, there are four separate windows to view. Here, we have History, Detail, Correlations, and Columns. In the screenshot below, we see the content of the Detail window. This Windows will be populated with the details of whichever event is selected in the 3rd main pane of the GUI. As shown below, I have selected an HTTP Zeek record. The full content of this record can be viewed in the third window pane by scrolling down, but it can also be seen in a better view from the Detail pane.
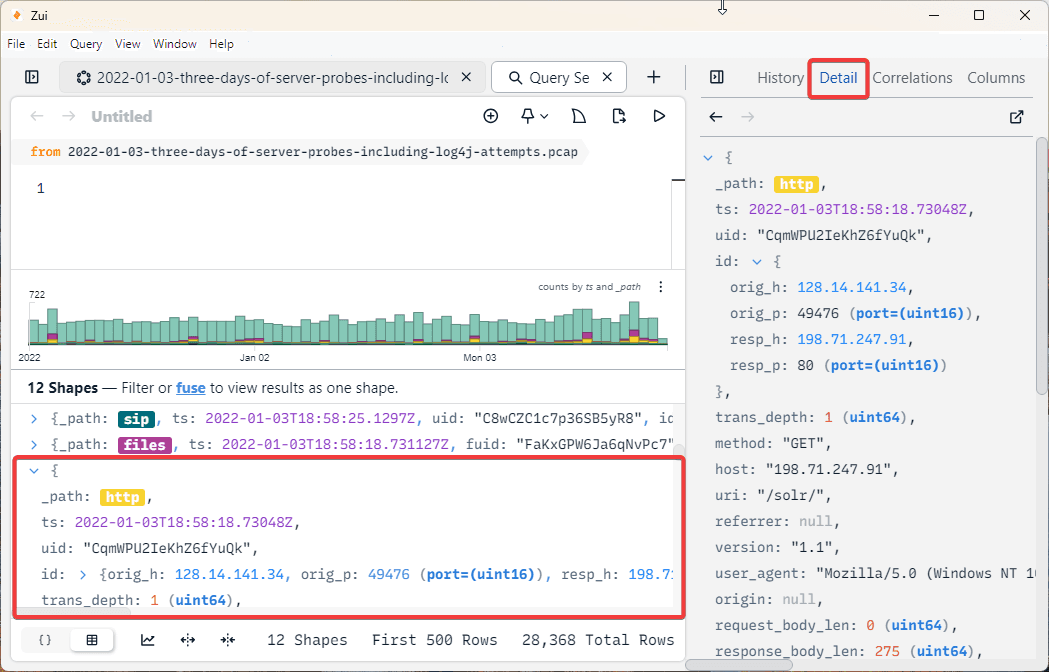
Importantly, we can see things like the timestamp, origin address and port, as well as the response address and port, among many other key details of the network traffic. Although, searching through these records manually would take a lot of time and would be like searching for a needle in a haystack. To start efficiently searching, we can first use some pre-built Zed queries to start to understand the query language. The pre-built queries were created by the original authors and be found here: https://github.com/brimdata/brimcap#brimcap-queries.
The pre-built queries can be imported using the blue plus button that can also be used to import additional packet capture files. By using the plus, we can then see the queries populated in the Queries drop down menu, which is next to the Pools menu we previously looked at. Under Queries, we can see a different row for each individual pre-built query which was in the file we downloaded. There are important queries such as Top Domains, HTTP Requests, File Activity, specific Suricata alert events, and more.
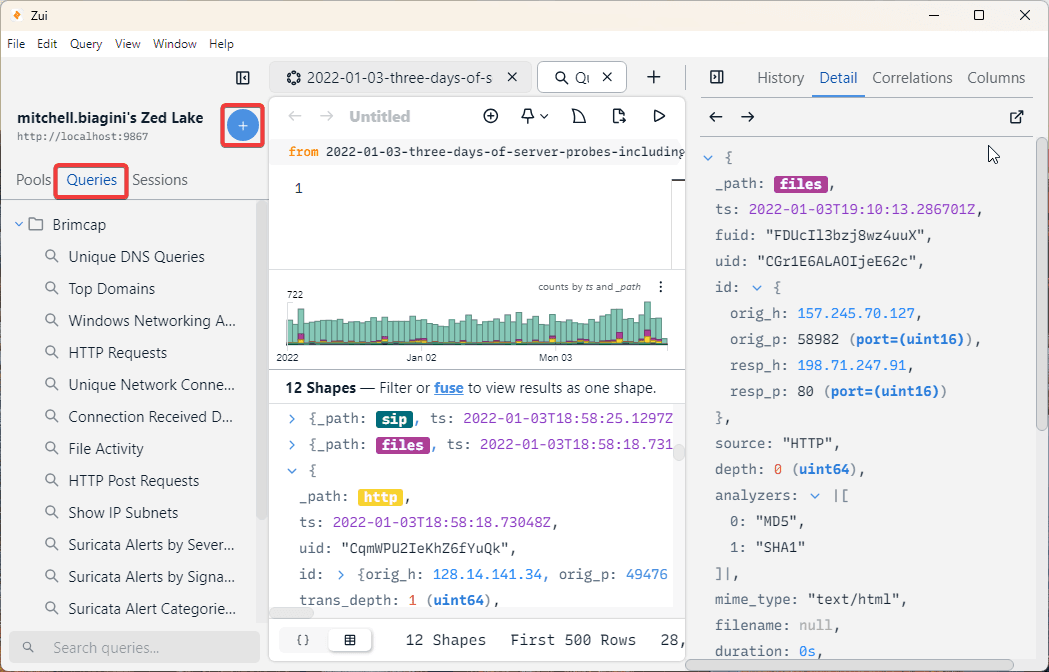
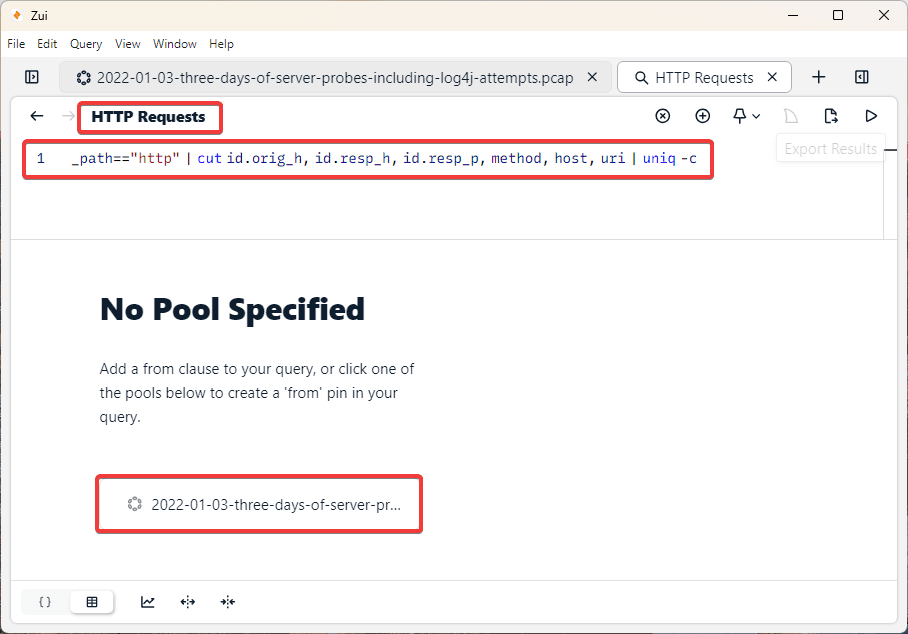
I’ve selected the HTTP Requests query. Now, a new window has opened which shows the header HTTP Requests and shows the Zed language query directly below. Before any query happens, we now must select the Pool we wish to query. In this example we only have one Pool to select.
Note: In the screenshot below, I have used the Toggle Left Sidebar and Toggle Right Sidebar buttons available on either side of the GUI in order to improve the quality of the screenshot. These buttons can be useful for navigating the GUI in the most comfortable and readable way.
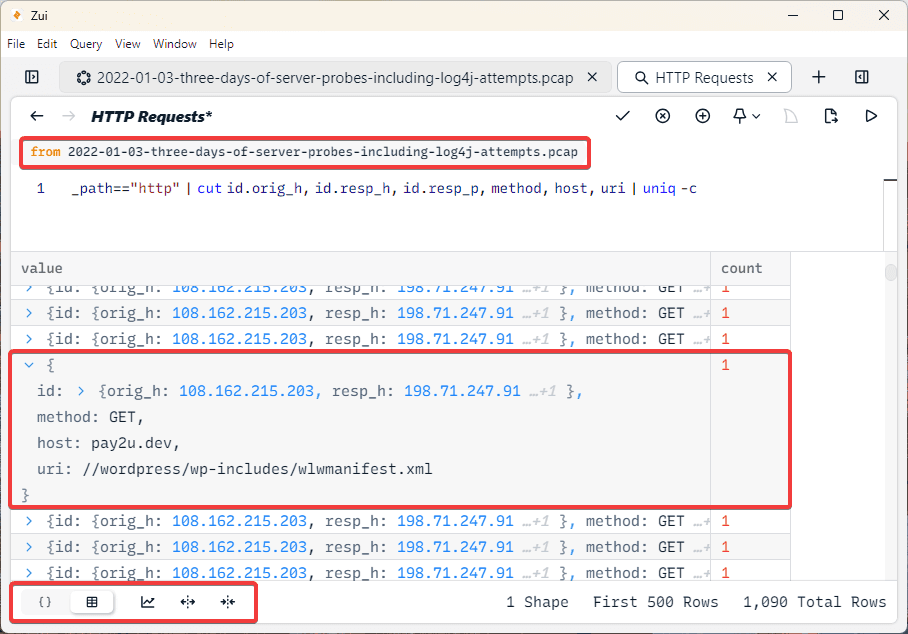
By selecting the pool we wish to query, our second pane will be flooded with data. As we can see in the screenshot below, a table has been created which shows all of the HTTP Requests. At the top of the image, we now see from our example PCAP file, showing us where the query is searching. Next, by using the arrows in the table, we can open each individual HTTP request to see the associated data. In the example I have opened, we can see the URI //wordpress/wp-includes/wlwmanifest.xml. We can also see the origin address, response address, and method. All of these details were also previously seen when we manually clicked on an HTTP event and inspected via the Details tab. Now, all HTTP requests have been organized into a single table for us to inspect much more efficiently. Additionally, in the bottom left, there are several options which let you customize how the data appears.
Now that we’ve taken a brief look at how Queries can be used to filter and search network traffic more efficiently, let’s switch to looking at other ways we can sort the data. By right clicking on any event, a new menu with many options will appear, as shown in the screenshot below.
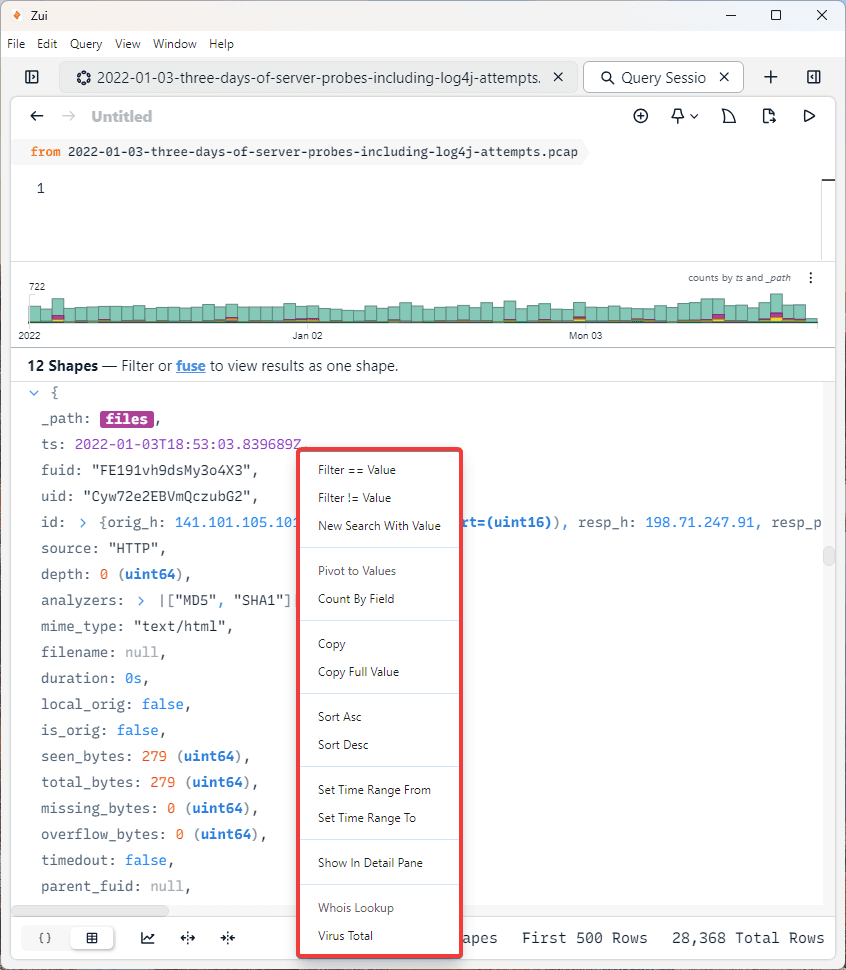
Here, there are many useful options that can filter the network traffic.
First, we see Filter == Value, this will filter the data where the selected value is equal. As we can see in the File event above, MD5 and SHA1 are used to hash the file data. We could select the hash value and use the Filter == Value option to filter for any of the same hash value that appeared in the network traffic. Or, we could use this for the Origin IP value to filter for
specifically an IP of interest.
Additionally, we can use the opposite option, the Filter != Value to find values that do not match the selected value.
We can also use the VirusTotal option to upload the value directly to VirusTotal. This could be very useful for uploading the SHA1 or MD5 hash of a file in order to quickly check it against the malware database.
Furthermore, there are additionally useful filtering features here such as the Sort Ascending and Sort Descending and the Set Time Range From and Set Time Range To.
These options seen in this menu are another feature which make Zui so powerful and efficient for searching through a large amount of network traffic.
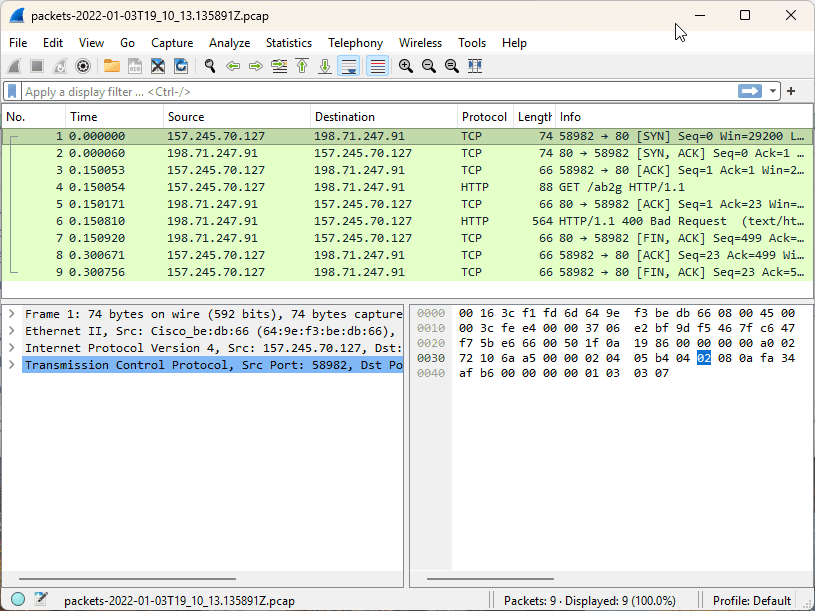
One of the best features of Zui is the built-in Wireshark integration. You may have noticed the shark fin icon in the top right of the main window. If you select an event, this icon will be selectable. By clicking this option, the actual packets from the PCAP file will be downloaded and opened in Wireshark.
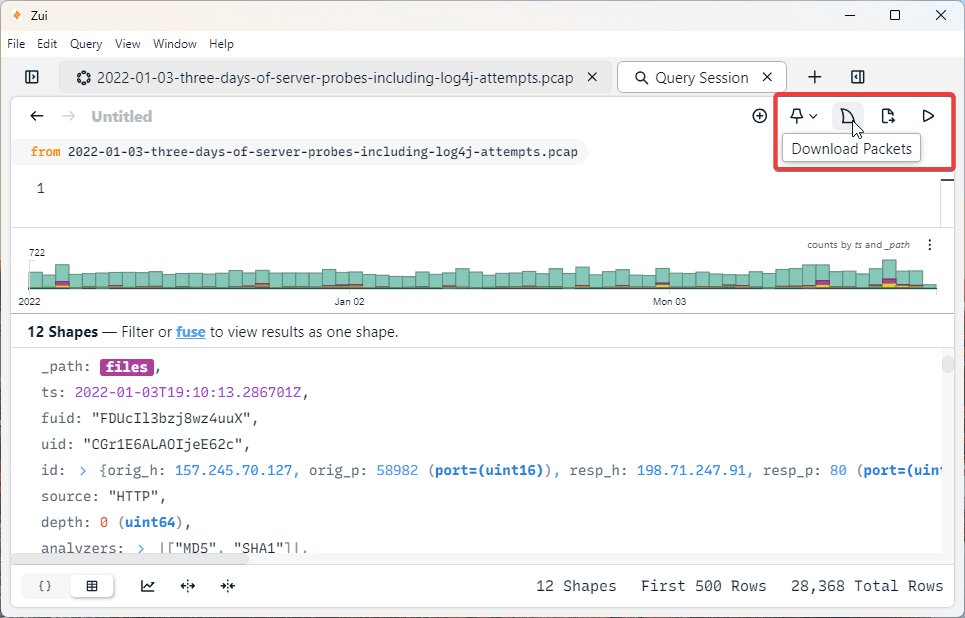
After clicking the shark fin icon shown in the screenshot above, the Wireshark instance shown below was created which features the packets in the File Zeek event.
Analysis Example
Using everything we know about Zui, let’s walk through some network traffic analysis using the tool. For this, I will use the network forensics exercise that can be found here, again from Malware Traffic Analysis. In this example, we know that there was an alert for a known malware (Lumma Stealer) that was detected by the SOC team on 2026-01-27 at 23:05 UTC. We’ve retrieved a PCAP from around the time of the incident so that we can start our investigation. Using Zui, let's examine this PCAP and find details relevant to our investigation.
First, if we navigate to the time the alert was received, I immediately notice several Suricata events with Alert Severity 1. These events align with the timestamp of the alert seen by the SOC team and immediately provide several important details.
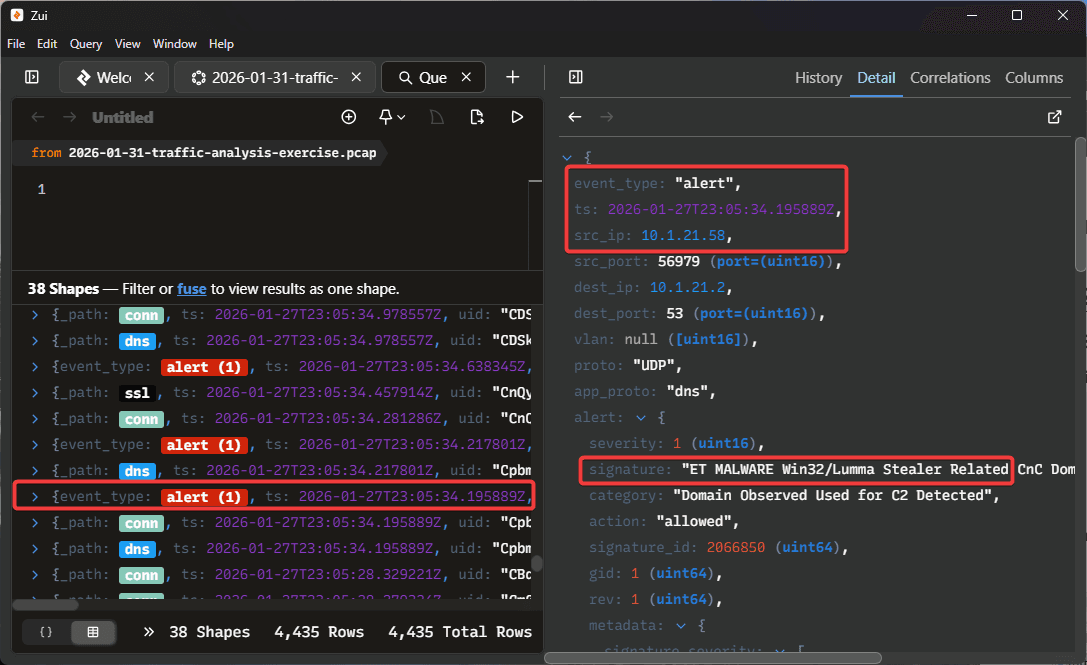
As we can see in the screenshot above, we can correctly identify the affected system IP (10.1.21.58), and the Suricata event has correctly identified the malicious behavior as "Lumma Stealer Related”.
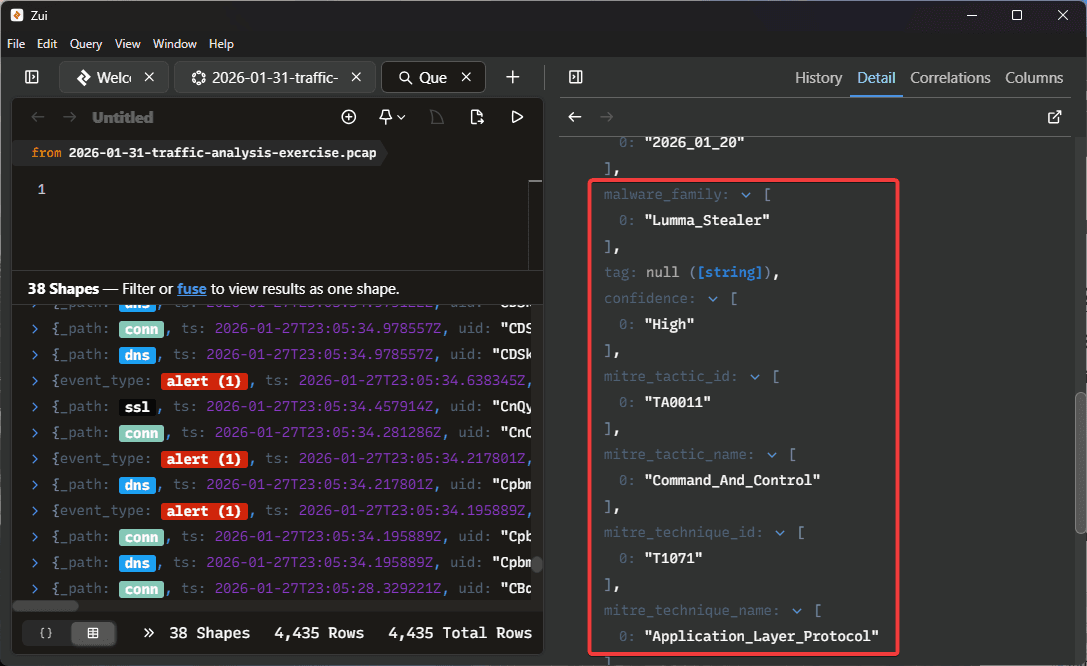
Looking closer at the details for this event, we can see the Malware family has been identified as the Lumma Stealer and the exact behavior observed was Command and Control. Suricata has also identified the MITRE tactic and technique ID’s.
Very shortly after we see Suricata Alert 1, we see several additional Alert 1 and Alert 2 events recorded at the same time. Additionally, we can see Zeek DNS and Connection events.
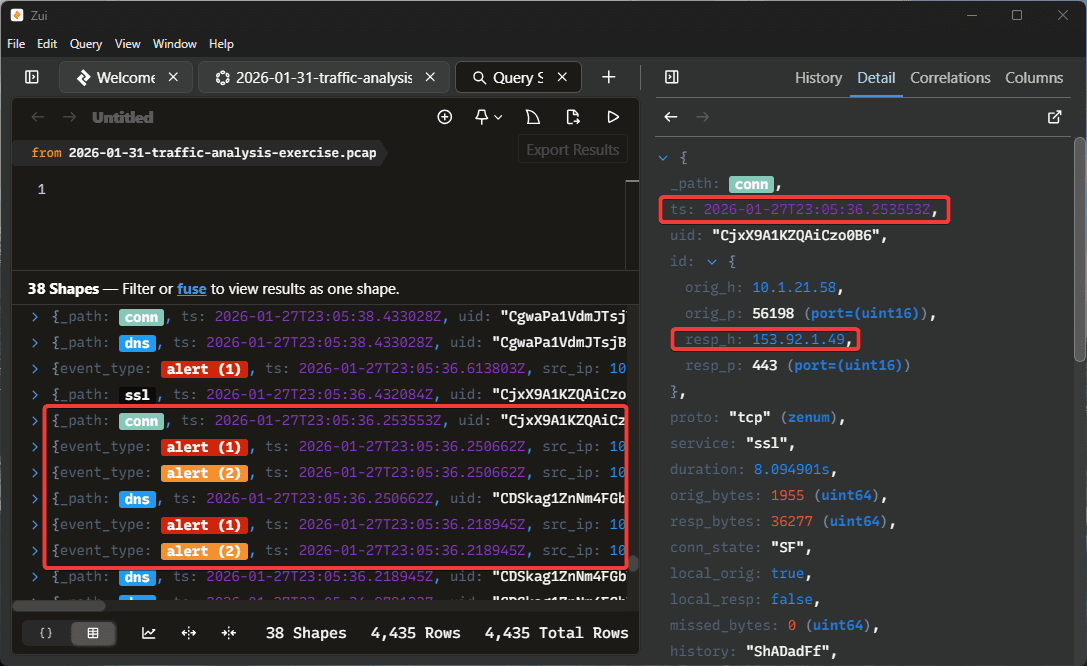
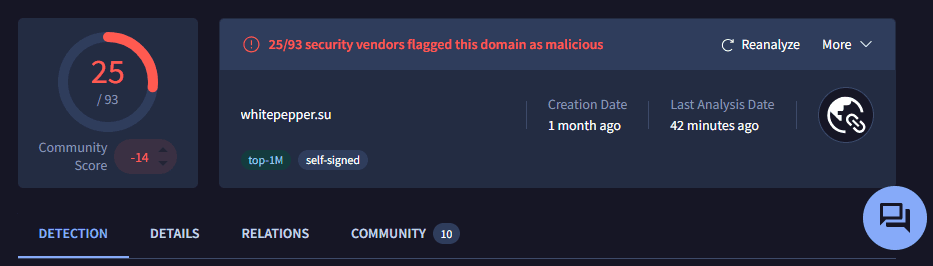
The Suricata Alert 2 events represent “Potentially Bad Traffic” and they have been recorded with additional Alert 1 events for the Lumma Stealer malware family. In the image above, I am looking at the details for the Zeek connection event which was recorded at the same time. Here, we can see the IP 153.92.1.49. If we look at the Zeek DNS event, we see the query for “whitepepper.su”. By selecting the “VirusTotal” option within Zui, a window was launched checking this domain with VirusTotal. Here, we can see it has been flagged as malicious.
Clearly, this connection seems to be the source for the malware activity that was detected by the SOC team. Just based on this brief example, we were able to quickly identify some of the key details of the network traffic for this malicious event. If we wanted to dive deeper into the particular connection event, we could use the Download Packets option and use Wireshark to find more details. I encourage you to find other exercises from the website provided and perform some network traffic analysis using Zui.
Conclusion
This guide should provide all of the information an analyst needs to know to get started working with Zui for bulk network traffic analysis. The biggest takeaway to remember is that Zui allows for very useful filtering and sorting to find relevant data in the most efficient way possible. Additionally, if we have a raw PCAP file but would like to quickly categorize traffic by Zeek and Suricata events, Zui is very effective. Furthermore, the direct integration with Wireshark allows the analyst to benefit the most when they also have a baseline understanding of using both tools.
To master this tool, learning more about the Zed language for writing custom queries and learning more about Zeek and Suricata events would be the most useful. Before starting to use Zui for casework, practice using the website used in this walkthrough for free PCAP files to experiment with analysis.
Authored by:
Mitchell Biagini
Frequently asked questions
Still have questions?
Can’t find the answer you’re looking for? Please chat with our friendly team.